Mobile friendly
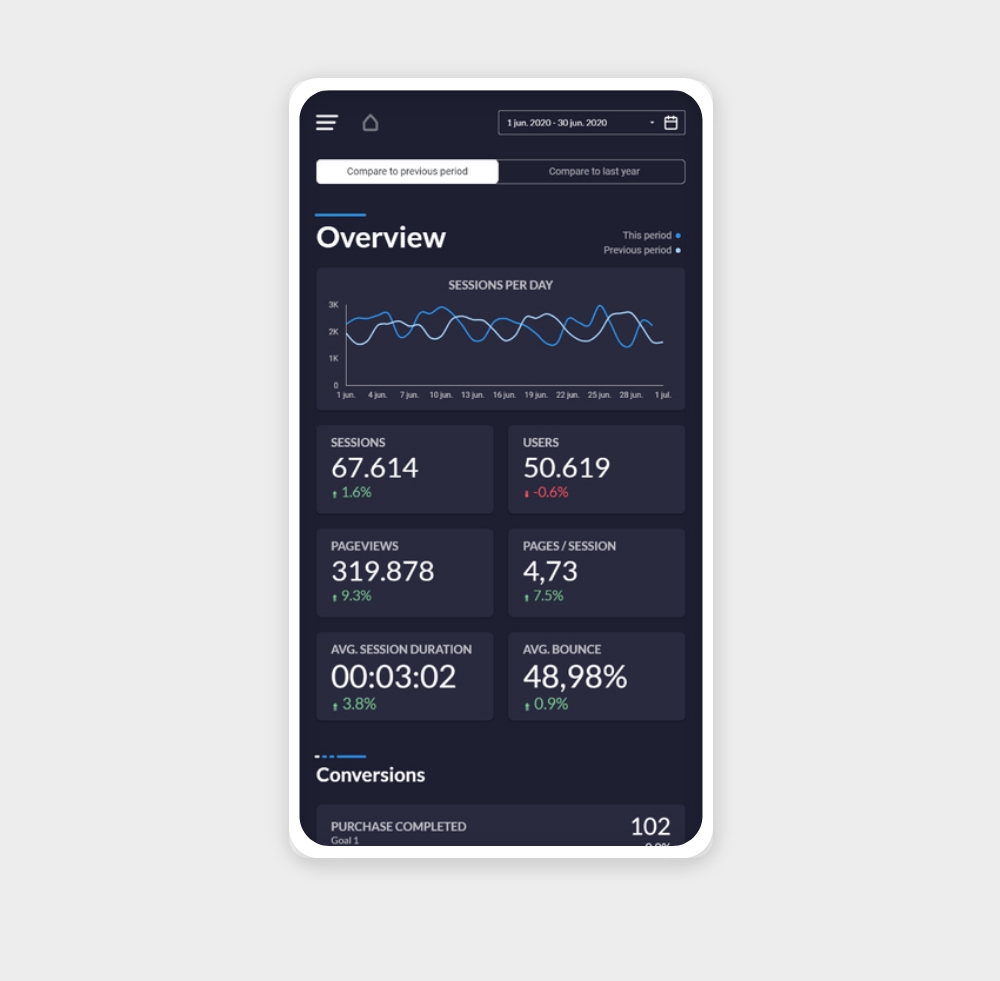
Website Performance (Mobile) Free
A free mobile-friendly Data Studio template for tracking your website performance. Monitor traffic, sessions, bounce rate, and top pages — all optimised for mobile screens.
✦ FreeView template
Data Source
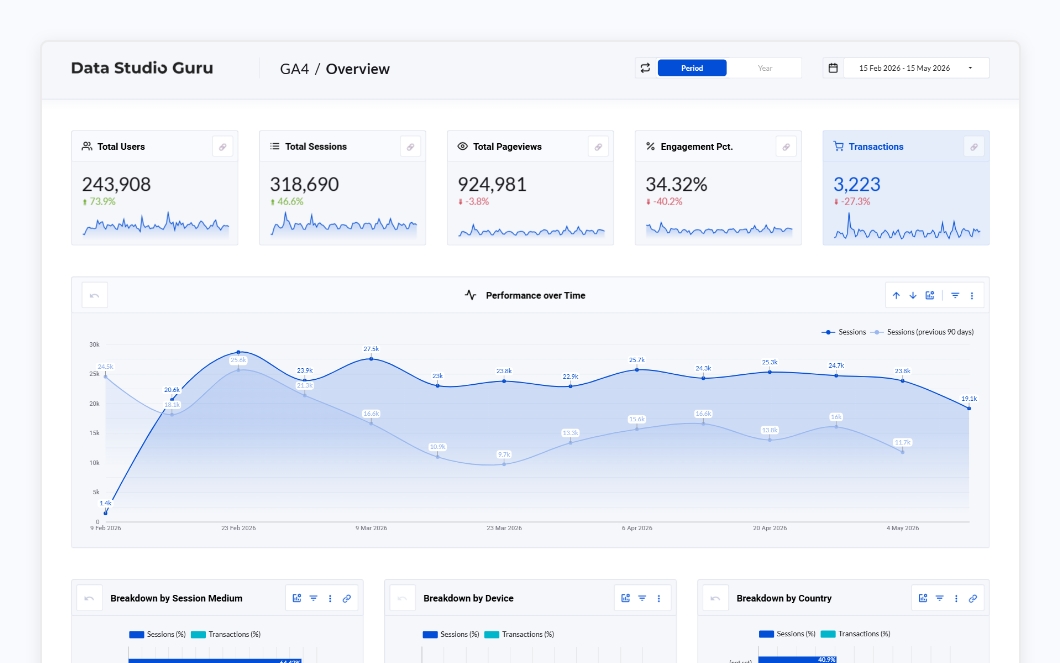
Connect GA4 data to beautiful Data Studio dashboards
Google Analytics 4 is the foundation of most digital reporting. These templates connect directly to your GA4 property and surface the metrics that matter — sessions, engagement rate, conversions, and revenue — without any manual data work.
Each template is designed to be connected and running in under 15 minutes.
Note: Data Studio connects to GA4 properties only. Universal Analytics (UA) data is no longer supported as Google shut down UA in July 2023.
Sessions — The number of individual visits to your site within a time period. One user can generate multiple sessions. Use this as your top-level traffic volume indicator.
Engaged sessions — Sessions where the user spent more than 10 seconds, viewed more than one page, or completed a conversion. A cleaner signal of genuine interest than raw sessions.
Engagement rate — Engaged sessions divided by total sessions, expressed as a percentage. GA4's replacement for bounce rate. Aim for 60%+ on most content sites.
Users — The count of distinct visitors. Compares with sessions to show whether growth is coming from new visitors or repeat traffic.
Conversions — Goal completions you've configured in GA4 (form submissions, purchases, sign-ups). The most direct measure of whether traffic is valuable.
Total revenue — E-commerce revenue reported via GA4's purchase events. Only populated if you have e-commerce tracking set up.
Average session duration — How long visitors spend on your site per session on average. Longer is generally better for content sites; shorter can be fine for transactional pages.
Bounce rate — Sessions where a user left without any engagement action. Included in the GA4 connector for backwards compatibility; prefer engagement rate for a cleaner read.
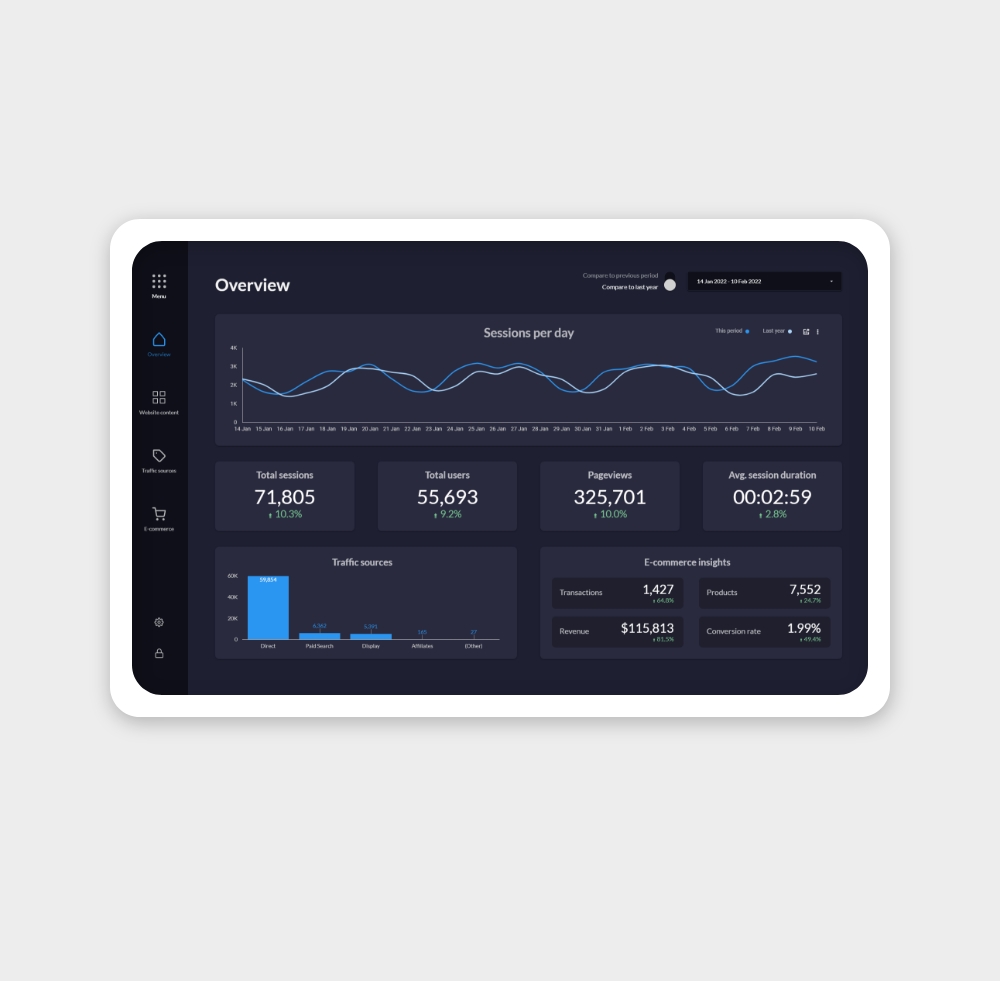
Weekly traffic reporting — Marketing teams use GA4 dashboards to report on weekly sessions, new users, and channel breakdown (organic, paid, direct, referral). A single Data Studio report replaces the weekly GA4 export ritual and keeps everyone looking at the same numbers.
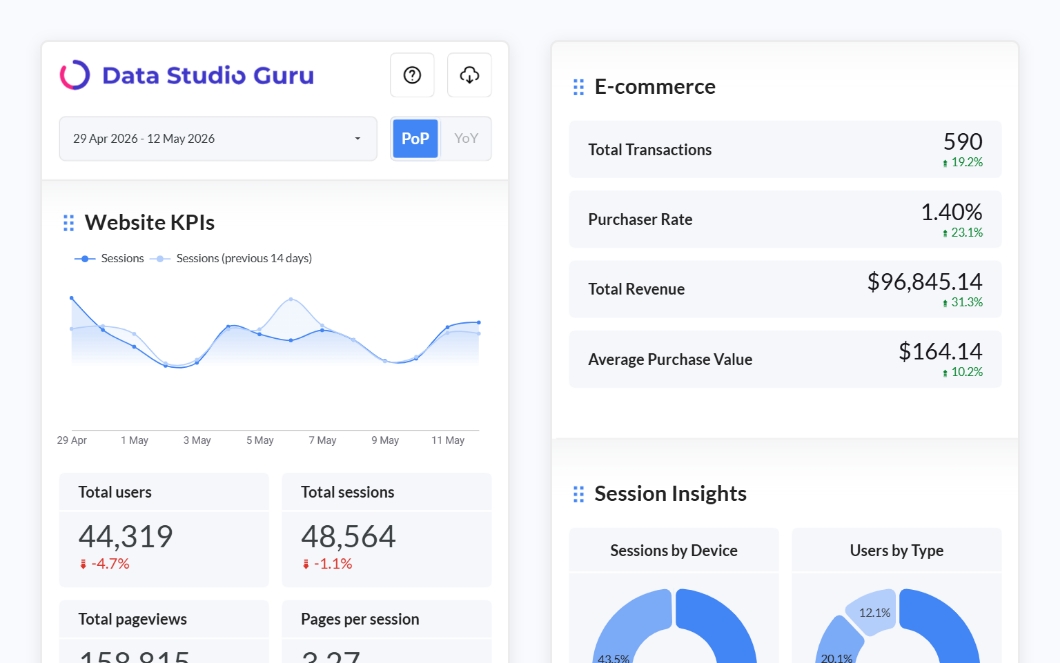
Conversion funnel monitoring — Product and growth teams connect GA4 to track conversion rates from landing page to sign-up or purchase. Data Studio makes it easy to add date comparisons so you can spot drops immediately rather than waiting for end-of-month reviews.
Client reporting for agencies — Agencies connect client GA4 properties to branded Data Studio dashboards and share a live link. Clients see live data without needing GA4 access — and the report always reflects the latest numbers without any manual refresh.
Why can't I find a metric I see in GA4? GA4's Data Studio connector exposes most, but not all, metrics from the native interface. Some calculated or blended metrics aren't available. Check the full list of available dimensions and metrics in Google's connector documentation.
Can I connect multiple GA4 properties to one report? Yes. Add each property as a separate data source, then use data blending to combine them in a single chart. This is useful for multi-brand or multi-region reporting.
Why is my Data Studio data different from GA4? Small discrepancies are normal and usually come from data sampling, processing delays (GA4 data can take up to 48 hours to finalise), or differences in how sessions are counted. For high-traffic properties, consider enabling unsampled reports in GA4's BigQuery export.
Do I need to reconnect after my GA4 property changes? Not usually. If you add new conversion events or data streams in GA4, the changes appear in Data Studio automatically on the next data refresh. If you migrate to a new property, you'll need to reconnect the data source.