After sharing a snapshot of a target visualisation built with a donut chart, I got a lot of questions about how it works. This guide walks through the full build — the Google Sheet, the formulas, and the Data Studio setup.
One important limitation upfront: this approach supports up to 100% over target (a maximum of 200% total). The donut is split into two 100% halves, so values beyond +100% won't display fully in the chart. The internal percentage will still be accurate, but the visual won't expand further.
Part 1: The Google Sheet
All the calculation logic lives in the spreadsheet. You need two source metrics: a target and an actual.
Data Sheet Structure
Create a sheet called Data with your source metrics — your target value and the actual value you're measuring against it.
Donut Graph Sheet
Create a second sheet called Donut graph. This sheet needs two dimension columns (Example and Dimension) and one metric column. The dimension values are numbered to control sort order in the visualisation.
The donut is built from five colour-coded segments:
| Colour | Meaning |
|---|---|
| Red | Actual is below 75% of target |
| Orange | Actual is between 75% and 100% of target |
| Grey | Remaining gap to target |
| Green | Target reached exactly |
| Dark Green | Actual exceeds target |
Formulas
Red (below 75% of target)
Check whether the actual value is below the 75% threshold. If yes, return that value. Otherwise, return null.
Orange (75% to target)
Captures the portion between the 75% threshold and full target achievement — the difference between the two when applicable.
Grey (remaining gap)
An IFS function covering multiple conditions. When the target hasn't been reached, show the gap between current progress and target. Otherwise null.
Green (target reached)
When actual equals or exceeds target, return the target value. Otherwise null.
Dark Green (over target)
Captures achievement beyond 100%, capped at 100% to maintain the donut's 50/50 structure. Values are divided by the target amount and limited to prevent overflow.
Invisible background half
This segment fills the opposite half of the donut until the dark green segment expands to fill it. Returns null when dark green reaches maximum.
Part 2: Building the Chart in Data Studio
Adding the Donut Chart
- Open your Data Studio report and connect it to your Google Sheet
- Insert a Doughnut chart
- Set the
Dimensionfield as the dimension - Set the
Metricfield as the metric - Configure sorting by
Dimensionin ascending order - If your sheet contains multiple examples, apply a filter to show only one at a time
Styling
Navigate to the Style tab and adjust the donut width to your preference. Then open Manage dimension value colours and assign colours to each segment:
- Segment 1 (Red) →
#EA4335 - Segment 2 (Orange) →
#FBBC04 - Segment 3 (Grey) →
#E0E0E0 - Segment 4 (Green) →
#34A853 - Segment 5 (Dark Green) →
#1E7E34
Adding Labels
Use Rectangle shapes to create labels distinguishing different examples in the background. Inside the donut centre, connect a metric from the Data sheet — typically the actual value and a percentage formula calculating actual ÷ target.
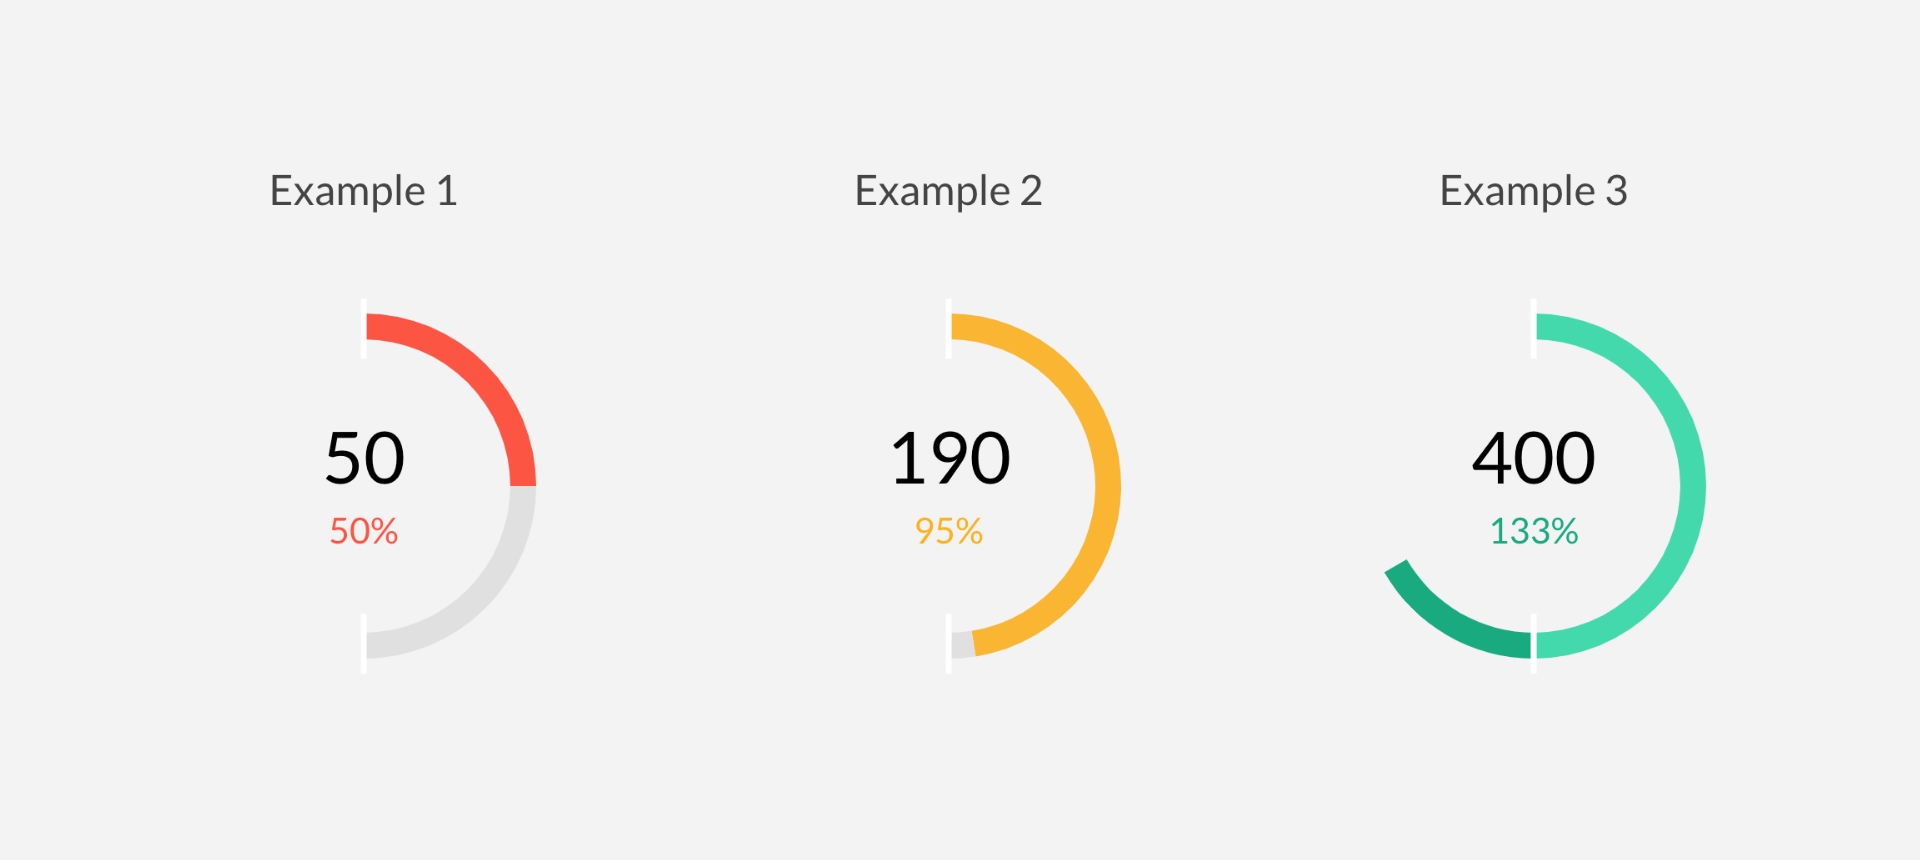
The Result
The finished chart shows target progress through colour-coded segments at a glance: red means you're well off target, orange means you're close, green means you've hit it, and dark green means you've exceeded it.
You can find the shared resources used in this post here: