“Très heureux de ce template, il est vraiment complet ! La vision des mots-clés par tranche est particulièrement intéressante, que ce soit en comparaison mensuelle ou annuelle. Mark est super dispo et toujours prêt à aider, ce qui est vraiment appréciable. Encore merci pour cet excellent travail ! 🚀”
Unlock the full power of your Google Search Console data with 300+ charts across 15 pages. Track rankings, clicks, CTR, branded vs non-branded traffic, mobile vs desktop, locations, and focus keywords — all with one-click period comparisons.
Search Console SEO Template
$99
View Free PreviewData Sources
Includes
- ✓Data Studio template (15 pages)
- ✓300+ pre-built charts
- ✓Native navigation and report-level filters
- ✓Report-level filters
- ✓PoP and YoY comparison
Single-user license. View license terms
Description
Maximize your SEO potential with this ultimate Google Search Console template for Data Studio. Perfect for marketers, SEO specialists, and small business owners, this all-in-one template transforms your Search Console data into actionable insights that help you track organic performance on Google—from high-level trends to granular keyword rankings.
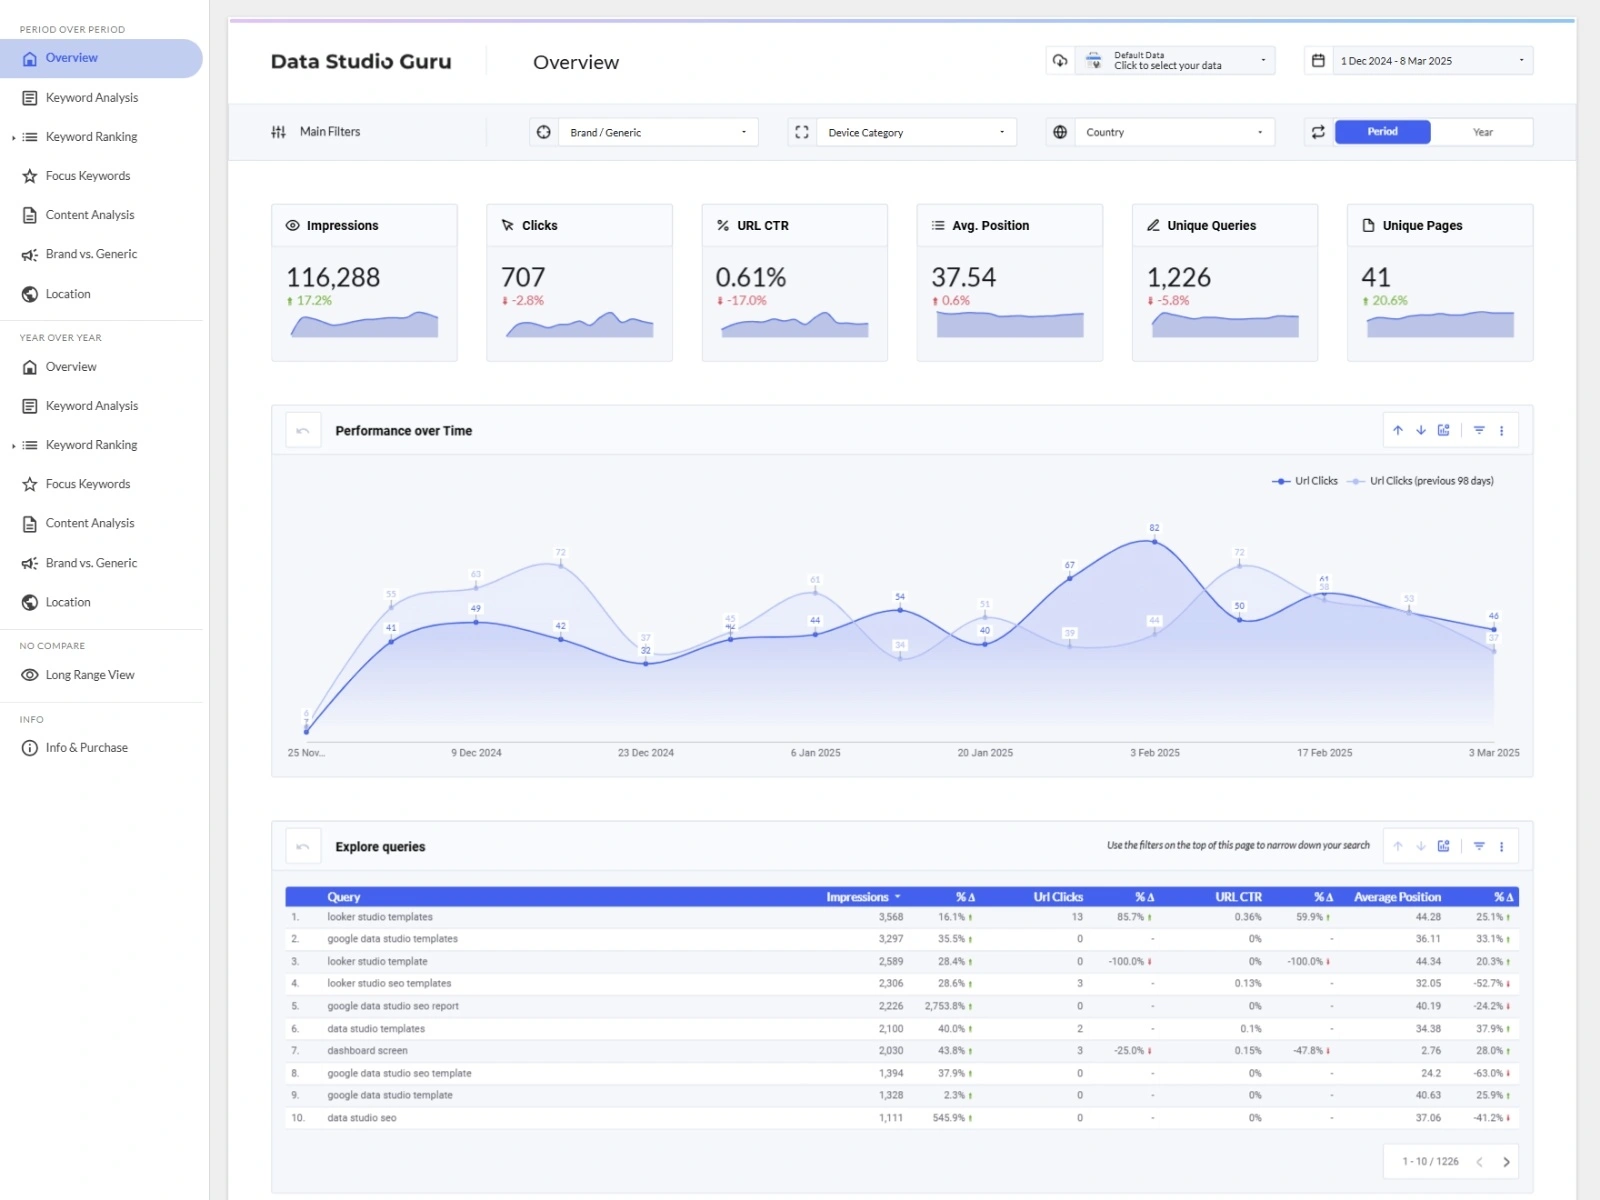
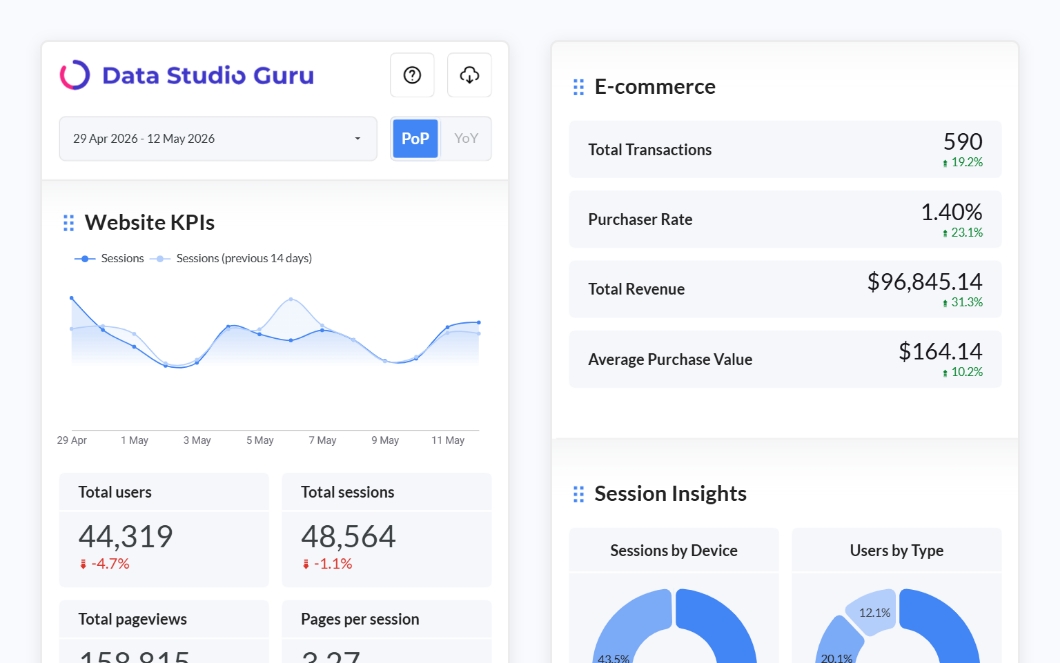
Designed with ease of use and a professional aesthetic in mind, this template features over 300 charts across 15 pages, leveraging the native Google Search Console connector. Track impressions, clicks, CTR, and average position, and gain deep insights into keyword performance, page rankings, mobile vs. desktop data, and branded vs. non-branded traffic. Whether you're monitoring your focus keywords, analyzing your website's content performance by category, or evaluating location-based traffic, this template has everything you need to stay ahead.
With built-in navigation and report-level filters, users can explore data effortlessly and customize reports to suit their needs. Compare your performance against the previous period or the same time last year with just one click. The template is fully customizable—simply update colors, swap your logo, and match it to your brand in minutes.
This template is ideal for both beginners and experienced professionals seeking an all-in-one solution to streamline their SEO reporting and gain valuable insights into organic search performance.
Preview the template by plugging in your own Search Console data. Once you purchase, you’ll gain full access to a copyable report you can integrate into your own Data Studio workspace.
Take your SEO analytics to the next level with this easy-to-use, visually stunning, and highly adaptable template. Don’t just track your data—understand it, act on it, and grow your online visibility!
Features
- ✓15 pages with 300+ charts
- ✓Impressions, clicks, CTR, and average position
- ✓Keyword rankings and performance analysis
- ✓Branded vs non-branded traffic segmentation
- ✓Mobile vs desktop comparison
- ✓Location-based traffic analysis
- ✓Focus keyword tracking
- ✓Content performance by category
- ✓Period-over-period and year-over-year comparisons
- ✓Fully customisable colours and logo
What's included
- ✓Data Studio template (15 pages)
- ✓300+ pre-built charts
- ✓Native navigation and report-level filters
- ✓Report-level filters
- ✓PoP and YoY comparison
Required data sources
- →Google Search Console
How to use
When you buy the template, you will receive a link to the report which you can copy to your workspace. Usually, you can change the data source during the copy process, but with this template, all custom fields and parameters will be lost during this step. There’s a workaround to bypass this. The key is to avoid changing the data source during the copying process. Instead, keep the original data source selected. While this may seem counterintuitive, it ensures the custom fields remain intact. Once the template is copied, you can reconnect your own data source, and everything should work as expected.
Here’s how to do it:
- Go to the template. Click on the template link in the purchase confirmation email.
- Click on ‘Copy’ (found in the 3-dots menu).
- Leave the Data Source as it is (even if it shows a warning icon), and click on ‘Copy Report’.
- In the copied report, you’ll see errors on all the graphs—don’t worry, this will be resolved in the next steps.
- Go to ‘Resource > Manage added data sources’.
- Click the ‘Edit’ button next to the data source. Click on 'Edit connection' in the top left.
- You will see a list of Sites, Tables and Search types. Select the Site you want to connect with. Click on 'URL Impressions' in the table list. Next, select 'Web' as your search type'. Now click on the 'Reconnect' button in the top right corner.
- Once you’re back on the report page, refresh your browser if the graphs did not update yet.
- All the graphs should now work with your data.
You will need to adjust the parameter defaults to match your brand and website structure. To do this, edit the data source, locate the parameter fields (click the @ symbol), and update their default values.
Changelog
v1.3
Feb 25, 2025
Improved the date range, changed the sparklines to weekly, and fixed a text issue.
v1.2
Feb 6, 2025
Toggled on 'Modern charts' mode and prettified the Overview page.
v1.1
Jan 8, 2025
Changes to 'Content Analysis' so that dimensions match in color across graphs.
v1.0
Dec 20, 2024
Initial release.
Frequently Asked Questions
Customer Reviews
“The template purchased by our company demonstrates exceptional clarity, professionalism, and user-friendly interface. The technical support provided was outstanding, characterized by expert knowledge, rapid response times, and professional courtesy in resolving all technical challenges. The overall quality of both the product and service exceeded expectations in terms of functionality and customer support.”
