Mobile friendly
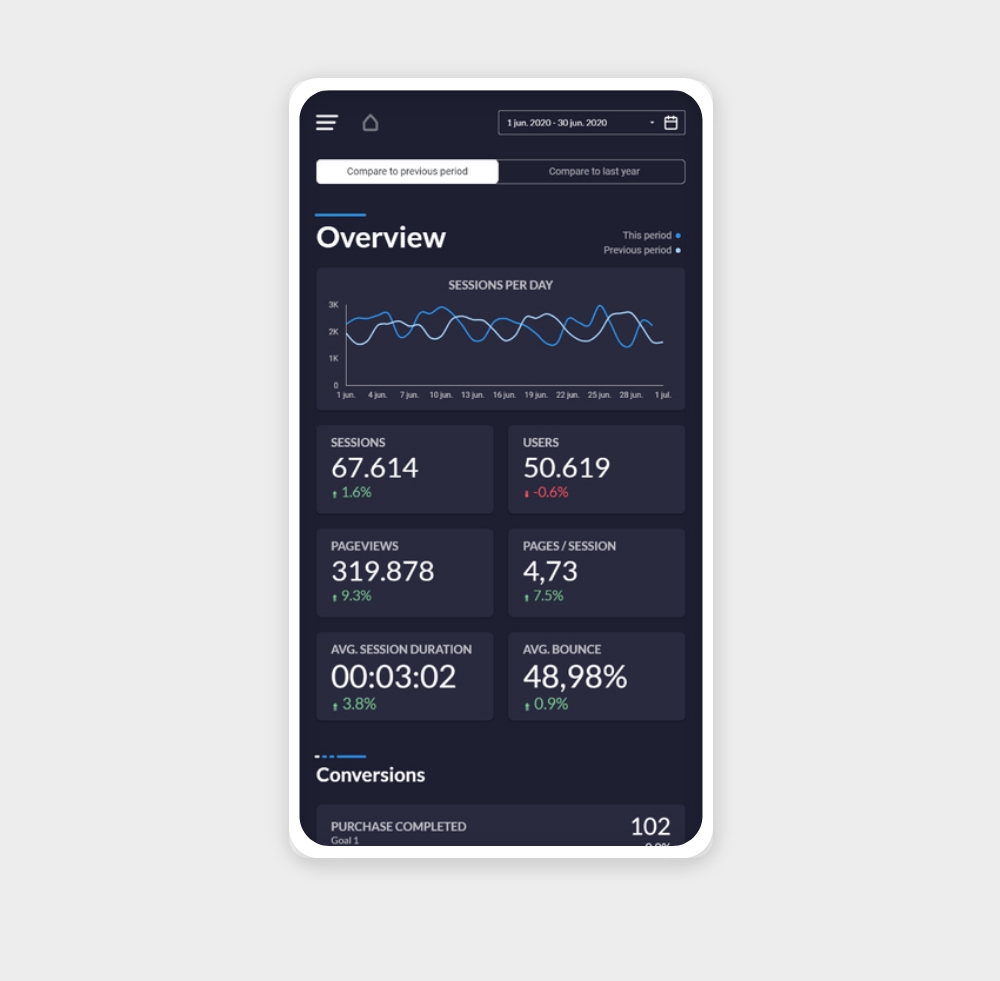
Website Performance (Mobile) Free
A free mobile-friendly Data Studio template for tracking your website performance. Monitor traffic, sessions, bounce rate, and top pages — all optimised for mobile screens.
✦ FreeView template
Data Source
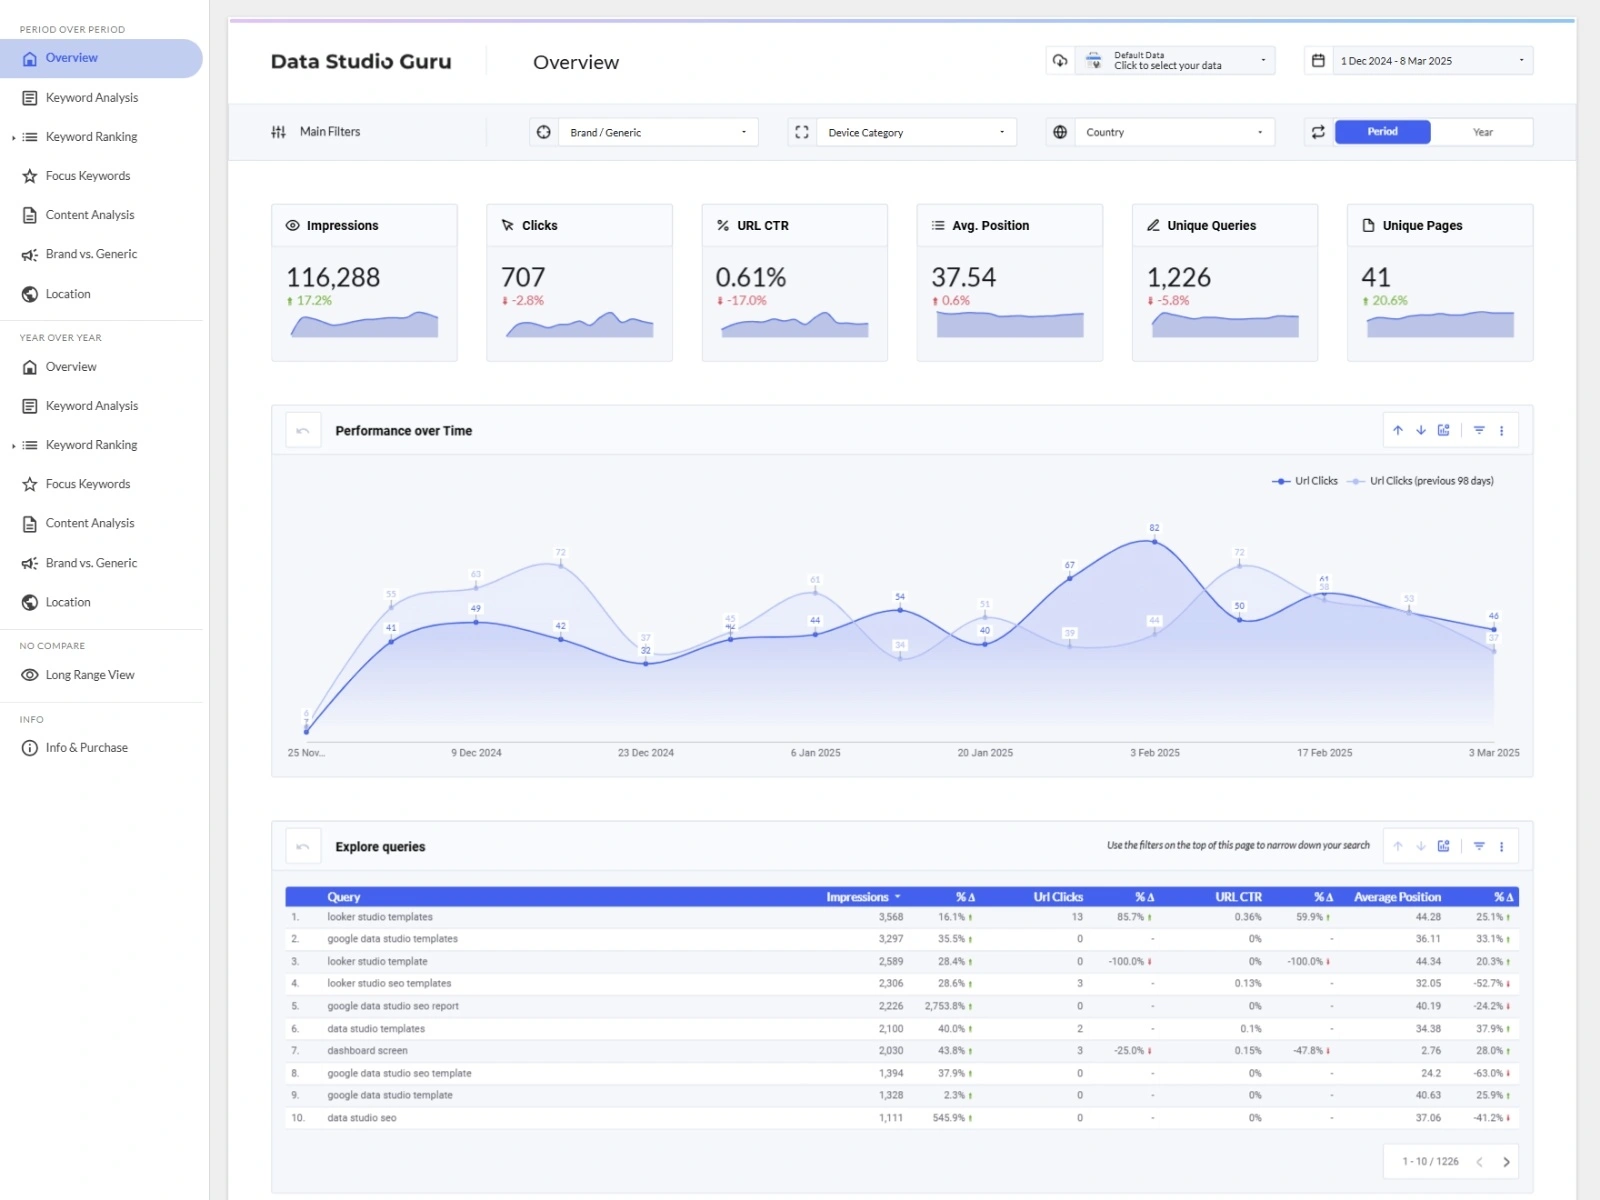
Understand your organic search visibility at a glance
Search Console data is notoriously difficult to analyse inside the native interface. These templates pull your impressions, clicks, average position, and CTR into a clean dashboard so you can spot trends, monitor keyword performance, and report on SEO progress with confidence.
https:// or domain property).Impressions — How many times any page from your site appeared in Google search results. An impression is counted each time a result is shown, whether or not it was clicked.
Clicks — How many times a user clicked through to your site from a search result. The most direct measure of organic traffic driven by a specific query or page.
Click-through rate (CTR) — Clicks divided by impressions. A low CTR with high impressions means Google finds your content relevant, but searchers aren't clicking — a strong signal to improve title tags and meta descriptions.
Average position — Your average ranking position for a given query or page. Position 1 is the top result. Positions 8–15 represent the highest-leverage improvement opportunities — close to the top but not yet capturing top-of-page traffic.
Indexed pages — Available via the URL inspection dimension: shows which of your pages Google has indexed. Useful for spotting crawl or indexing issues that suppress traffic.
Core Web Vitals pass rate — Available via the CrUX dimension in Search Console: the share of your URLs passing Google's Core Web Vitals thresholds (LCP, CLS, INP). Failing pages may be deprioritised in ranking.
SEO progress reporting — SEO teams and agencies use Search Console dashboards to show clients month-over-month and year-over-year changes in impressions, clicks, and average position. Data Studio makes it easy to add period comparisons with a single date range control.
Keyword opportunity identification — By filtering to queries with average position between 8 and 20, you can surface high-impression keywords that are close to the first page. These are the best candidates for content updates and on-page optimisation.
Content performance audits — Filter by page URL to see which pages are driving organic traffic and which are stagnating. Pair with GA4 engagement data using Data Studio's data blending feature to see which organic-traffic pages actually convert.
Why does Search Console data in Data Studio not match the native Search Console interface? The connector applies the same 16-month data window and the same sampling rules as the Search Console API. Small differences in how date ranges are calculated (calendar vs. rolling) can cause minor discrepancies. For exact match, use the same date range and apply the same property filters in both.
Can I see keyword data broken down by page?
Yes. Add both Query and Page as dimensions in the same chart. Note that combining them increases data dimensionality, which can trigger more aggressive sampling on high-traffic sites.
Why are some of my pages missing from the data? Pages must be indexed by Google to appear in Search Console data. If a page is missing, check its indexing status using the URL Inspection tool in Search Console directly.
Can I connect a domain property vs a URL-prefix property? Yes, both work with the Data Studio connector. Domain properties aggregate all subdomains and protocols, which usually gives a more complete picture. Select whichever property you've verified in Search Console.