Data blending solves a specific problem: you want metrics from two different sources side by side in the same chart. GA4 sessions next to Search Console impressions, both broken down by landing page. If all your metrics already live in one source, don't blend — blending adds query overhead and introduces join complexity that's easy to get wrong.
How a blend works
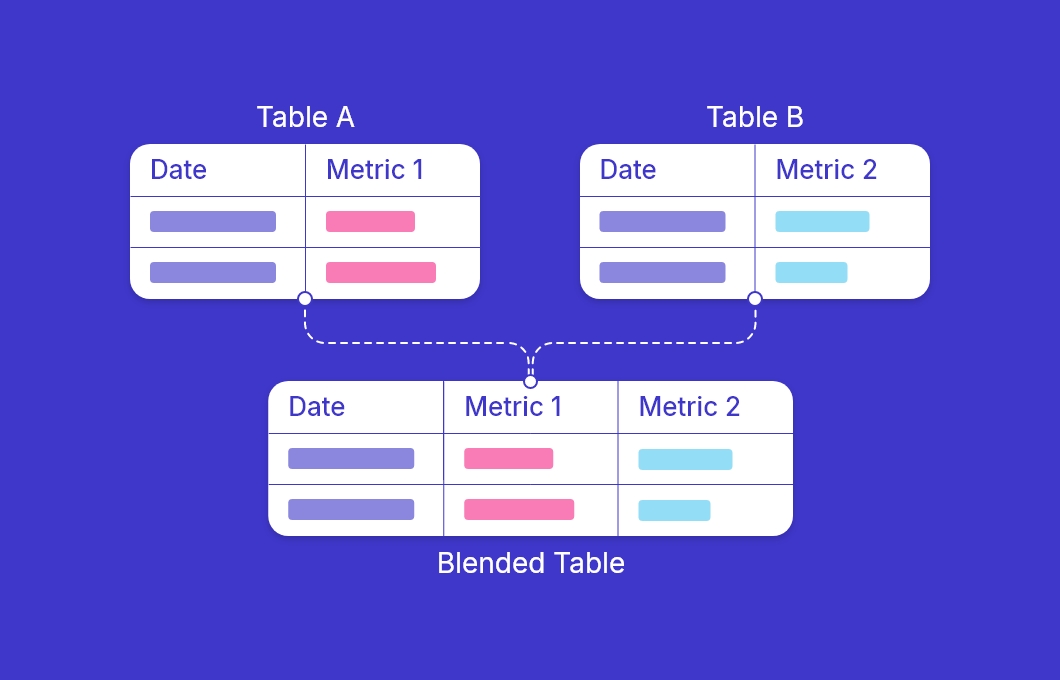
A blend is a virtual join between two or more data sources performed at query time. Data Studio supports four join types in the blend editor — left outer, right outer, inner, and full outer — but every join condition must be an equality match. You can join on Field A = Field B, but you cannot use >, <, or ≠ as the condition.
The most commonly useful type is the left outer join: it returns all rows from your primary (left) table and fills in matching data from the right table where available. Rows from the left table with no match in the right table produce null, not zero. That distinction matters when you're writing calculated fields on top of a blend — null values propagate in arithmetic, so Sessions + null returns null, not Sessions. Use COALESCE(field, 0) to convert nulls to zero where you need accurate sums.
One more thing to understand: metrics in the underlying data source become unaggregated numeric dimensions inside the blend. This means the aggregation method (sum, average, etc.) you've defined in each source doesn't automatically carry over. You will need to apply aggregations explicitly — for example, using SUM() in a calculated field within the blend — rather than relying on the field's default aggregation.
Creating your first blend
There are two ways to open the blend editor. The quickest is from within a chart: select the chart, go to the Setup tab in the right panel, and click Blend Data at the bottom of the data source section. Alternatively, go to Resource > Manage blended data sources from the top menu and click Add a blend.
Once inside the editor:
- Your first data source appears on the left as the base table. Select the dimensions and metrics you want to include from it.
- Click Join another table to add your second source. Choose the data source and select the fields you need.
- Click Configure join between the two tables. Pick the join type (left outer is the default choice for most use cases) and set the join key — the shared dimension that links the two sources, typically
Date,Page, orCampaign. - Give the blend a descriptive name in the top-right corner so you can identify it later.
- Click Save. The blend now appears as a selectable data source in any chart on this report.
Join key rules
The join key is the dimension Data Studio uses to match rows between sources. A few things that trip people up:
- Values must be identical. Join key matching is exact — values must match precisely. String dimensions are generally lowercased at the connector level (GA4, Search Console), so mismatches are more likely when using custom data sources like Google Sheets. If one source has
google / cpcand another hasGoogle / CPC, they won't join. - Field names don't have to match. You can join
Datefrom GA4 toDatefrom Search Console even if the underlying field identifiers differ — Data Studio maps by value, not name. - Granularity matters. Joining
Date(day) from one source toDate Hourfrom another produces multiple rows per day on one side with no matches on the other. Make sure both sources are at the same level of detail before you blend. - You can use multiple join keys. If joining by
Datealone produces duplicate rows (e.g. when campaign data has multiple entries per day), add a second key likeCampaignto tighten the match.
Adding more sources (up to 5)
Data Studio allows up to 5 tables in a single blend — this is a hard cap with no in-product override. You can use a different join key for each additional table you add, so source 3 doesn't have to share the same join dimension as sources 1 and 2.
When you need more than 5 sources, you have three options.
Workarounds for the 5-source limit
1. Pre-aggregate in Google Sheets
Pull data from multiple sources into a single Google Sheet — manually, via a scheduled export, or with a connector like the Google Analytics Sheets add-on. Once everything is in one sheet, you're pointing the blend at a single source rather than five separate ones. This is the lowest-tech solution and works well for weekly or monthly reports where real-time data isn't critical.
2. Use the Extract Data connector
The Extract Data connector caches a snapshot of any existing data source. You can use it to merge two sources into one pre-joined snapshot, freeing up slots in your blend. It's the same connector covered in the performance guide — here it does double duty by both speeding up the report and consolidating sources. The trade-off is that the cache needs refreshing manually or on a schedule; the data won't be real-time.
3. Push joins to BigQuery
If you have access to BigQuery, this is the cleanest long-term solution. Write a SQL query or a scheduled view that joins all your sources upstream, then point Data Studio at a single BigQuery table or view. You get the full power of SQL for complex joins, no 5-source restriction, and typically faster query performance than blending multiple live connectors in the browser. If you're already using GA4 with BigQuery export, this path is especially natural.
Quick recap
- Data Studio blends support up to 5 tables with a hard cap — no workaround within the product itself.
- The left outer join is the most common type; unmatched rows return
null, not zero — useCOALESCE(field, 0)in calculated fields to handle this. - Join conditions support equality only — values must match precisely, and string case depends on the connector.
- Open the blend editor from Resource > Manage blended data sources or via the Blend Data button in a chart's Setup tab.
- Match your join key granularity — mixing
DatewithDate Hourwill break your data. - For more than 5 sources: consolidate in Google Sheets, use the Extract Data connector, or pre-join in BigQuery.
If you need to compute new metrics on top of a blend — ratios, combined totals, conditional logic — see the calculated fields guide for the formulas that work best in blended contexts.